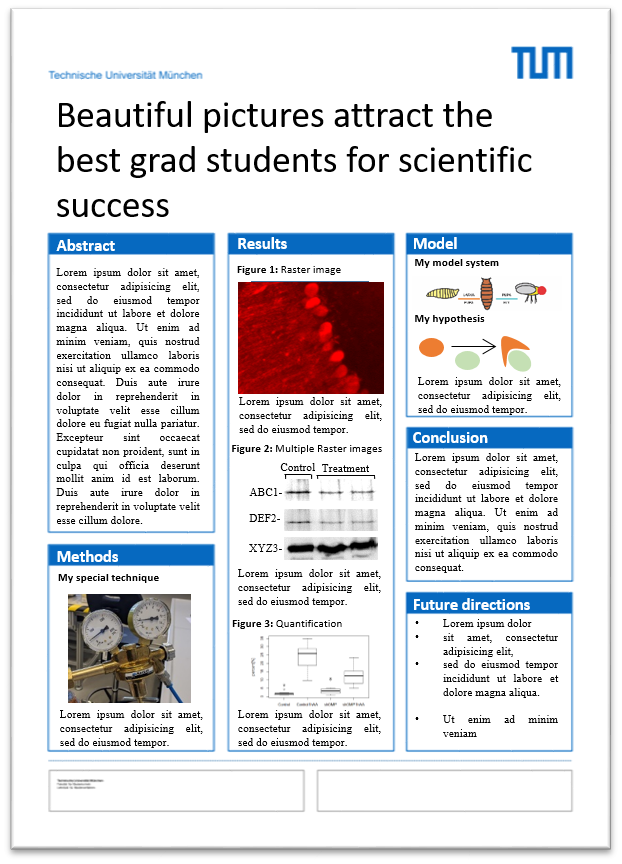
The goal of this course is to introduce the students to scientific presentation using both drawings, pictures and graphs. During the course they are introduced to different (mostly freely available software for preparation of vector graphics (Inkscape, Biorender, Power point), image manipulation (Image J, Adobe PhotoShop) and graphical and statistical analysis (R). The students are welcome to work with their own data sets, but if necessary example data sets can be requested from the organizer.
The format of this course is a mix of lectures and student exercises within a ZOOM session. During the course, the students will create their own scientific poster and populate it with abstract, summary and at least 1 vector graphic, 1 pixel image, 1 graph and 1 statistical test. The guided exercises during the course on a sample data set will allow the students to complete their homework using their own data. For some weeks (R data import, R statistics) additional homework for a separate example data set will be analyzed and checked through an online quiz in Moodle.
Contents: Vector drawings, raster images, global vs. local image manipulation, descriptive statistics, linear regression, non-parametrical statistical methods, ANOVA
- Dozent: Angelika Harbauer
